Home » Astronomy
Category Archives: Astronomy
Response to EAS Council’s reply
27 June 2022
The vast majority of EAS sustainability advisory committee members have stepped down in protest against the inaction and obstruction by EAS Council with regards to developing the EAS Annual Meeting to an inclusive and sustainable meeting. After about 1.5 years of discussing “behind the scenes” – and not having reached a single tangible result of actual emission reductions for future meetings – we felt compelled to go public with our frustration at the Council’s inaction. The Council responded in the same issue of Nature Astronomy. Their response, however, contains a number of inaccuracies that we wish to address:
“we […] have engaged extensively with them on the matter”
While there has been some degree of communication, the Council has, on several occasions, failed to respond to our queries and concerns, or done so after a long delay. While they have stated that our input was appreciated, they have not actually engaged with us openly and proactively, by keeping us (and the membership at large) from participating in the design of the meeting or any preliminary discussions.
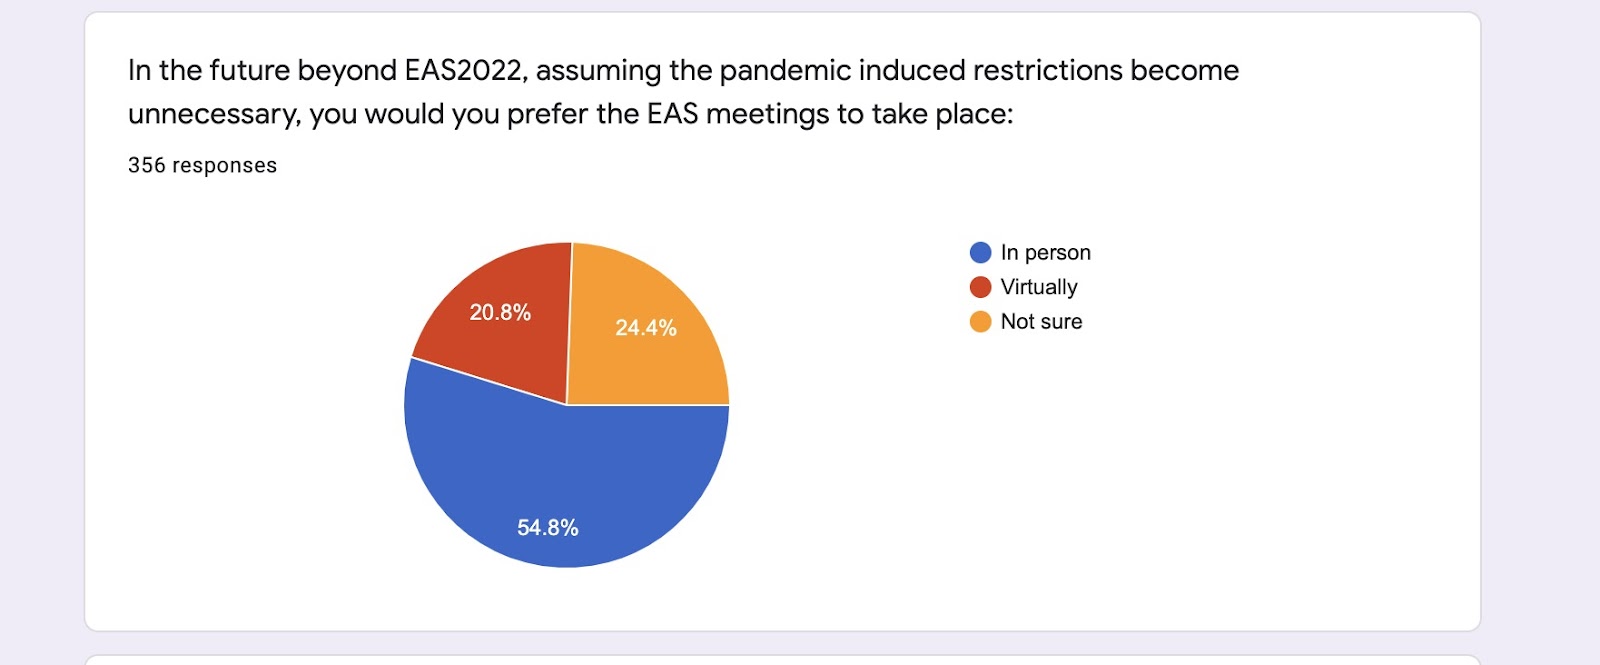
“When we consulted our membership there was an overwhelming preference for a face-to-face meeting this year, with just one in six people indicating that they would prefer virtual attendance if we were able to offer a hybrid EAS 2022.”
It is very problematic when survey results, which have not been published but are partly available to us, are reported in a distorted way. The question that EAS posed in the survey was “In the future beyond EAS2022, assuming the pandemic induced restrictions become unnecessary, would you prefer the EAS meetings to take place…” and offered the options “In person”, “Virtually”, and “Not sure”. The survey did not address the question whether people would like to participate remotely at a hybrid conference. It asked whether the meeting should take place fully online or fully in-person and it did not ask about hybrid options, nor did it explore the concept that different formats are suitable for different goals and purposes. Nevertheless, 20.8% of all respondents, which is significantly more than “one in six”, answered that they preferred virtual meetings and another 24.8% responded “Not sure”. Only slightly more than half (54.8%) responded “In person”. By claiming that there was an “overwhelming preference for a face-to-face meeting”, EAS Council wilfully distorts the results of the survey.
Assuming that the hybrid format is designed and executed effectively following contemporary best practice, we are convinced that the majority of our community would not be opposed to having a virtual attendance option at an in-person meeting. We also note that best practice for online and hybrid interaction is evolving rapidly, and that many experiences to date are commonly not reflective of best practice or of what is possible in these new formats. Despite the relevance of the EAS meeting format to future sustainable practices, the EAS sustainability committee was not allowed to contribute to the post-meeting and community survey design, as stated above. We also notice that the number of responses in this survey is very small, in comparison with the total number of EAS members, which recently exceeded 4500. The reliability of its results is therefore rather doubtful.
The relevant result of the EAS 2021 conference survey as shared on 27 Jan 2022 with the sustainability advisor committee, is shown below.
“After over two years of online-only meetings we wanted to provide the opportunity to students and early career researchers, the group most disadvantaged by the lack of in-person meetings, to network with others, to showcase their work, and to establish new connections. One third of the more than 1,600 registrants at the meeting are students, a cohort who are vital to the future of European astronomy.”
Early career researchers (ECR) often do not have the means to travel to a very expensive conference. They would be most helped with a state-of-the-art hybrid (or online) meeting at an affordable rate. The fact that the online version of the EAS meeting in 2020 and in 2021 had significantly more participants (1777 and 2464, respectively; numbers from our own research and the EAS newsletter #14, respectively) than the EWASS 2019 meeting in Lyon (1240) speaks for itself. The EAS 2022 annual meeting has seen a very large number of physical attendees, too (1700, according to the EAS newsletter #17); it is unclear, though, if this is a one-time effect due to it being the first physical meeting after three years. Also, the participation rate has still dropped by over 30% relative to 2021. We note that there are an additional 300 online watchers for the 2022 meeting, but we don’t count them as participants since they are not allowed to fully participate in the meeting.
Several works showed that people who are most keen to travel are in fact senior astronomers. Stevens et al. 2020 have shown that senior researchers travel about ten times as much as Ph.D. students. And a survey following the on-line meeting IR 2020 showed that it was mostly senior members of the community who had troubles with networking at the on-line meeting. On the other hand, according to the same survey, a surprisingly large number of junior researchers found that the networking possibilities on-line were even better than in legacy meetings.
However, even without considering the above-mentioned results, we believe that offering a hybrid option would not damage young people – on the contrary, it would help them.
In addition, it is the voice of the ECR community that must be central in discussions about what is best for them, and it is already clear that prioritising inclusivity and sustainability is a key motivating factor for ECRs when they look to the future (e.g. Kohler et al 2022).
“Providing a fully hybrid meeting would add more than €70,000 to the cost of the meeting for equipment rental and technical support, which we judged to be more than we could afford.”
The EAS Council have historically used the conference organising company KUONI, whose quotes are exorbitant compared with the services or technology provided. There are alternative state-of-the-art solutions that could have been used for a hybrid meeting of this magnitude, at a fraction of the quoted price. The Council would have been aware of these solutions, had they chosen to engage with us for the organisation of the meeting.
The Council has not been transparent about the costs of the EAS2021 meeting, even in their annual report at the General Assembly or when actively asked by members. The costs can be reconstructed, however: At the EAS 2021 meeting, a total of 2464 people participated. Assuming, conservatively, that 464 people did not pay at all, and that all the rest paid only the member fee of 150 €, means that the conference had a budget of about 300 k€. The entire scientific organisation of the meeting as well as the local hosting were given “in kind”, i.e. for free, by the conference and session SOCs and Leiden Observatory, respectively. A small profit (35k€) was reported (“expected”) in the (still in draft) minutes of the 2021 General Assembly. This means that the lion’s share of the conference budget for the 2021 online conference must have gone to KUONI, a conservative estimate would be 250 k€ for running this conference (including software licenses, which are typically only a few k€ for state-of-the-art solutions). Again, this is only an estimate as the actual numbers are not public. We advocate that as part of planning for the future of academic conferences, the budgets of large-scale high-cost gatherings should be made transparent and open, in order for the community to be best-placed to judge whether the investment is of best value to them as community members funding it.
Nevertheless, this estimate is important as it puts the quoted 70 k€ for adding a hybrid component in a very different light: It would only be a small fraction of the entire budget (which presumably is considerably larger for a legacy-style meeting than the online-only costs for 2020 and 2021). However, both the budget for running the (online) conference itself as well as the budget for the hybrid component are extremely excessive by all technical standards and could easily be brought down if Council were willing to openly discuss their conference model with members or their advisory committees and consider alternative options than the traditional, high-cost model.
For example, a decent hybrid setup could be provided by providing the following components per room at very low cost or technical complexity:
- camera showing presenter + slides (free — presenter simply shows their slides via Zoom on their own laptop)
- second camera showing audience (use one of the organisers’ laptops — free or alternatively invest a suitable camera technology that becomes a reusable asset)
- microphone(s) to be able to hear everyone (e.g. a throwable microphone from Catchbox.com, ca. 500 € for a single one or ca. 1000€ with added extra microphones for speaker/moderator)
- Technical setup: to be done by session organisers with help from LOC / hosting committee (as standard in most conferences); we know from several organisers who would have been happy to help with this had Council just allowed it…
- video hosting and Zoom licenses: e.g. ca. 1000 € for professional video hosting at Vimeo for one year (free with YouTube), 100 € for one month of Zoom Pro.
- Professional messaging system, e.g. free versions of Slack or Discord are sufficient
- stable (not necessarily very fast) WiFi: must be part of a modern conference centre (if not, choose a different conference centre!), alternatively use a wired connection; again this is standard in business facilities these days. Portable low-cost high-speed dongles are also widely available and can be used in the absence of reliable venue internet.
All in all, a decent hybrid setup could have been provided for probably not much more than 15 k€ even for 13 parallel sessions. And these are actually not costs, but investments that can and should of course be re-used in the following months and years. Obviously this is only an indicative and low-complexity attempt that can and needs to be improved in the following years. But we have really no time to lose and must start this now.
“We are at a loss to understand why the signatories to the letter believe that we “did not offer a hybrid option for EAS 2022 — despite our protests — in order to ensure that the meeting attracted sufficient in-person attendees”. This is completely false. Our motivation was to provide the in-person experience requested by members without incurring the unaffordable cost of a fully hybrid mode for 13 parallel sessions.”
It is a strong statement to say that something is false that the EWASS board chair has verbally stated exactly in this way. Also in e-mail messages EWASS board members wrote “we definitely want the participants to come to Valencia” as the Council can easily verify themselves. It was apparently a Council decision to force people to come physically to Valencia if they want to take part in the meeting. In addition, as noted above, the justification of in-person being driven by the request of members is a weak argument, given the lack of support in the community for this and the fact that the survey question was not posed in a way that allowed the community to express their preferences effectively.
“Remote attendance has always been available for the plenary sessions, which are the heart of our annual meetings, to allow those who could not (or prefer not) to travel to Valencia. In addition, this includes access to e-posters and interaction through Slack and the online platform. This comes at a substantially reduced registration fee of €80.“
The on-line attendance that EAS offers to their annual meeting this year is a half-hearted attempt that will not convince anyone of on-line participation as an effective format. Perhaps that is partly the point, and the low participation in this pseudo-hybrid format will later be used as an excuse that there wasn’t enough interest anyway? State-of-the art digital meetings are designed with a “digital first” principle in mind, otherwise remote attendees will only be second class watchers. Effective hybrid interaction is only possible when effort is dedicated to ensuring a good experience for all audiences, rather than focusing solely on the in-person and seeing the online as an afterthought add-on.
The bulk of the scientific discussions at EAS meetings happen in the sessions, as the EAS Council must know. Not granting remote access there means that especially early-career researchers, people with caring duties, disabilities, or people who are actually aware of the climate emergency and refuse to fly, are deprived of the option to take part effectively in this year’s meeting – in contradiction to the self-stated goals of the EAS to foster inclusivity and sustainability.
“We are pleased to confirm that we have found a way for EAS members who are not able to attend the conference in person to have virtual access to our General Assembly.”
It is only through repeated pressure from us and the broader community that the EAS Council have, at long last, conceded on this point, something they fail to acknowledge in their statement.
“This year the Society signed the UN Climate Neutral Now Initiative, making a commitment to substantially reduce our carbon footprint by the end of this decade.”
Again, this signature was only made because of the suggestion and subsequent pressure from the sustainability working group. Again, there is no acknowledgment of our involvement in this crucial decision. However, the signature alone is not sufficient, but must now be followed by active climate action, which the EAS Council has been unfortunately unwilling or unable to take in our interactions with them to date. If there was the need for another example beyond EAS2022, holding a council meeting in Crete (23 May 2022) shows that beyond the scene the Council wants to keep running business as usual and get back to the “old normal” rather than look for ways to adapt in the future..
All in all, if it is not clear to the community today, it will become obvious soon that the current EAS leadership is not able or willing to guide European astronomy to a sustainable and inclusive future. A fundamental shift in either strategy, leadership, or both, is urgently needed to future-proof and improve European astronomy, as well as contributing to the evolution of academic practice on a global scale.
“The Society remains committed to exploring sustainable solutions for future annual meetings in pursuit of that goal.”
The time for exploring was one or two decades ago. Now is the time for urgent action.
Despite many words, what we are missing in EAS Council’s response is an acknowledgement of the crisis we are in and of an ambition to lead our field via tangible impactful actions into a sustainable future!
– Leo Burtscher, Lola Balaguer-Núñez, Valentina D’Orazi, Didier Barret, Tobias Beuchert, Emre Dil, Agnieszka Janiuk, Beatriz Mingo, Eloisa Poggio – and with input from Vanessa Moss of “The Future Of Meetings” community of practice
Competing interests
Our key interest is to preserve our planet, both for our community and humanity at large.
The open science workshop at the Stifterverband
This is a follow-up to my post 2 days ago about open-ness in astronomy, with some observations and comments from the corresponding workshop yesterday in Berlin, organized by the Stifterverband. The workshop was visited by about 30 people from all parts of society — researchers, library managers, civil servants from national and foreign science ministries, as well as people from industry (software, automotive, airport services, among others). In the spirit of open-ness the workshop adopted the “Chatham House rule” which essentially says that you may report freely about what has been said, but only if individual participants cannot be identified.
The workshop was organised in discussions within the respective sectors science, administration and industry and round-the-table discussions with everyone. As always in a workshop with such a diverse audience and broad aim (“to explore potentials and challenges from open research and innovation processes”), it is hard to give a one paragraph summary of the many topics discussed, but I will try nevertheless.
An “innovation culture” needs to admit errors
Most participants agreed that open-ness is a mindset that helps with innovative thinking, but it was also agreed that there are limits to open-ness, e.g. due to privacy (e.g. patient data in medical applications) or security (e.g. when in connection with critical infrastructure) concerns. To be able to openly discuss not just final results, but also your way there (e.g. your methods), requires some tolerance towards failure. If you cannot risk to fail, you can also not be open as you will only talk about your project after you have achieved some major success. And it also requires some trust or self-confidence that you will have another good idea in case the one you publish today is being picked up by someone else.
The measure becomes the target
In the discussion group on open-ness in science the discussion was focused on the question “how can we fix science?”. Science is becoming more and more an industrial machinery, optimised for maximum impact and citation numbers, opting for certain results (that are often boring) rather than trying out radical new experiments (that often fail). Science managers and politicians try to increase the “output” for a given level of (public) funding and need to be able to measure the output in order to report on changes. Generally the output is now seen as number of papers and number of citations each paper receives. However, focusing too intensively on these narrow indicators leads to the effect that many scientists now try to maximise their impact as measured by these numbers, rather than try to work on something bigger that does not (immediately) result in a large number of papers or citations. Think about the gravitational wave experiments which produced null-results for decades – before receiving the Nobel Prize this year. Other metrics, such as Altmetic which measures the impact of your research in society, may be helpful to get a wider view of the relevance of research projects.
Publication bias
Typically people only publish their studies if they find a result. If nothing could be measured or the result was deemed not of interest, it is not published. A participant called the so-accumulated knowledge “dark knowledge” and cited an Austrian funding agency which estimated (by looking at allocated budgets) that this “dark knowledge” grows 2-3 times as fast as published knowledge. It was agreed that also failures should be published, but it was also agreed that publishing null-results is not honoured in our current research system, or as one participant put it: “How many unsuccessful scientists do you know”?
Science as the stroke of a genius or regular work?
Underlying many discussions about how to measure success in scientists, how to evaluate scientific work (and scientists themselves!), is the question of how scientific progress is perceived. Unfortunately many people still believe science progress when some genius has a fantastic idea. This can occasionally be the case, but usually even the genius bases his or her insight on published literature which to the most part consists of hard work by hard working people, trying out new methods and slowly progressing in understanding some topic. It was felt that this work is often not properly appreciated. We concentrate too much on people who have done some fantastic new thing, rather than on the many “smaller” scientists who contributed to the success of the “genius”. This is also reflected in the current job situation, especially in Germany, where there is little room for normal working academics: You’re either a (perceived) genius and can then advance to become a professor or you’re continuously on short-term “postdoc” contracts without stability or job security.
CitizenScience
There was some uncertainty as to how best open up the scientific process to the general public. Some believed that the next big step, after simple press releases and more interactive talks / blogs / social media is a full participation of the general public via citizen science projects. Others were more cautious and thought this is just a “hype” that is only applicable to a small set of projects. Indeed in astronomy, the GalaxyZoo project mentioned also in my previous post was highly successful, but it is unclear if citizens’ help in classifying galaxies will be needed in the future given recent advances in machine learning codes.
What can science contribute to society?
Finally the question was discussed what can science contribute to the wider society? Here I’d like to describe two of the most widely discussed points:
- Science contributes skeptical thinking. Skepticism is one of the basic traits of a good scientist and encourages everyone not to take claims for granted, but to critically ponder whether they can be true, ask for references, proof and repetition. In times of “fake news”, “climate deniers” and vaccination hoaxers, the importance of this trait cannot be overestimated. It was also stated that science needs to be healthy to encourage skepticism. If we only try to reach the maximal numbers of papers or citations, this does not necessarily help to question existing paradigms and make real progress.
- Science may also contribute tools and best practices for open-ness, such as the distributed version-control system github, open access publication platforms, and other tools to openly share information. Note that also the world-wide web was initiated from a research environment (the CERN) and it was created in an effort to make information accessible. Nowadays, this would perhaps also be called open science…
Update (16 March 2018): The Stifterverband has published a white paper on Open Science at their webpage describing their initiative for Open Science and Innovation (both are in German).
Astronomy as an example for an open science
When a former Max Planck colleague who now works at the Stifterverband, a public-private think-tank, called me in October and asked if I wanted to take part in a workshop about open science, I was unsure what astronomy could offer in this regard. However, when simply writing up the tools and processes many astronomers use (and take for granted), it quickly becomes clear that astronomy is very much an open science already.
In the spirit of open science, I would like to document here my preparation for the discussion section of the workshop tomorrow.
What does openness in astronomy mean?
- Open data: access to raw data (e.g. through the ESO archive) as well as access to surveys (e.g. through VizieR) and meta-data (e.g. through Simbad). The access is available for everyone and in most cases either in near real-time or after a proprietary period of maximum 12 months (in most cases).
- Open source: access to scripts, libraries, programming tools, codes, … that are used to analyse the raw data and derive scientific results. In the most open projects (such as astropy), even the development process is open and anyone can contribute via e.g. github. Platforms such the Astrophysics Source Code Library, on the other hand, publish the final code itself and make it searchable through standard literature search engines.
- Open access means free and unimpeded access to consolidated scientific results as published in peer-reviewed journals. While many relevant astronomical journals, including the just recently launched Nature Astronomy, are not open access by themselves, most (all relevant?) journals now allow publishing the author’s copy on preprint servers such as on the arXiv. Most current research articles can be found on “astro-ph” (the astrophysics’ section of the arXiv). Still troublesome, however, are technical articles (e.g. about telescope or instrumentation projects), that are published in the SPIE proceedings. A google search for the fulltext of the article, including “filetype:pdf” as a further filter, often reveals the author’s copy, however. In some cases, authors can “rebel” against the copyright notice they typically have to sign in order to publish an article (see example below for one of the articles published during my Ph.D.).

Example of a modified copyright agreement granting only a non-exclusive license to the publisher and thus allowing to publish my own article on my homepage or on preprint servers.
- Apart from open data, open source and open access, open science can also encompass outreach and communicating with the public. This can be in more traditional “teaching” ways through blogs (e.g. the German SciLogs platform on which I have blogged about my trips to Chile during my Ph.D. and later), talks, open house days etc., but in some cases it can also mean directly embedding citizens in your research project, such as demonstrated successfully by the GalaxyZoo project that involves citizens to classify galaxy morphologies, a task in which humans have so far been better than machines.
- Open science should can also include transparent selection procedures. After all, the particular selection of proposals, job candidates, laureates etc. can shape the de-facto view of a field for a long time and therefore comes with big influence and power. This could, for example, mean to publish the criteria which will be used to select a candidate for a job and to democratically nominate committees that decide about proposals and prizes. This is partly the case in astronomy, e.g. the committees that help select proposals for the Deutsche Forschungsgemeinschaft are elected by the scientific staff themselves.
- Last, but not least, I believe open science should also include democratic structures in universities and research institutes. Usually, in German universities, there are “Fachschaften” that have a say on the selection of professors, and the Max Planck society sponsors one of the largest Ph.D. networks in the country, the Max Planck PhDnet. On the more senior, but not yet tenured, level, however, the situation is less good. Attempts to form a postdoc network within the Max Planck Society have not been greeted with sympathy in several institutes as some directors fear to lose influence if juniors also have a say. This is, however, not specific to astronomy, but rather a general symptom of the research and higher education landscape in Germany.
Why do we promote open-ness in astronomy?
Astronomy is a highly competitive field (typically only one out of 20 astronomy Ph.D.s eventually gets a tenured research position). Open-ness in astronomy would not be supported if it weren’t also promoting competitiveness and productivity.
- Regarding data, observatories, that run big telescopes, promote open science in order to increase the observers’ desire to quickly publish “their” data (lest others “steal” them). Top-nodge data are often publicly available from the start. The first observations with the next, biggest space telescope will be open access from day 1, as announced today. The first observations for instruments built for the European Southern Observatory ESO, are also usually publicly available from the start, e.g. these GRAVITY science verification data. Other data are usually openly accessible after a 12 month “proprietary period”. This can sometimes be in conflict with the “owners” (PIs) of the data.
- Regarding open source, the motivation to publish tools and software code is manifold: the author(s) of the code publish it in order to promote their code (and collect citations to associated research papers), but also so that others can contribute in the development. Last but not least, publication is the best way to help others in finding bugs and errors and therefore make your own research more credible.
- Open access is in the interest of everyone except scrupulous publishers who want to make a profit from publicly financed research. It helps to promote science and the scientific method, also in the wider society, if the basic results are openly accessible. And it helps researchers from poorer countries who cannot afford paying expensive subscription fees to Nature, Science et al.
- Public outreach also helps everyone, but can be a burden for researchers who also have to teach / supervise students, manage projects, deal with bureaucracy and publish, publish, publish. Motivations to nevertheless indulge in public outreach reach from simple PR for your own research (in order to attract more research money or to boost one’s ego…), but can also include serious collaboration with the public (see GalaxyZoo). Often the motivation for being active in public outreach is also to promote the scientific method (e.g. the Science March initiatives) or a feeling of a moral obligation as publicly funded research should also be of benefit for the public.
- Transparent selection procedures and democratic structures, finally, are also a win-win situation: researchers gain trust in the process and will therefore try harder to win prizes, fellowships and jobs. The academic institutions, on the other hand, win by becoming more attractive to a wider range of (international) applicants. The only downside is an increased effort of documentation / communication, but I believe the benefits well outweigh the costs.
I am interested to see the discussion tomorrow and will try to report back with a view from the other participants / fields as well!
Update 15 Nov:
- Added link to the summary blog post
- I realised that the fantastic literature database we use every day in astronomy is not something that should be taken for granted. Many other fields do not have their “ADS”, but platforms like Science Open are trying to change that.
Can you see the CMB in your analog TV?
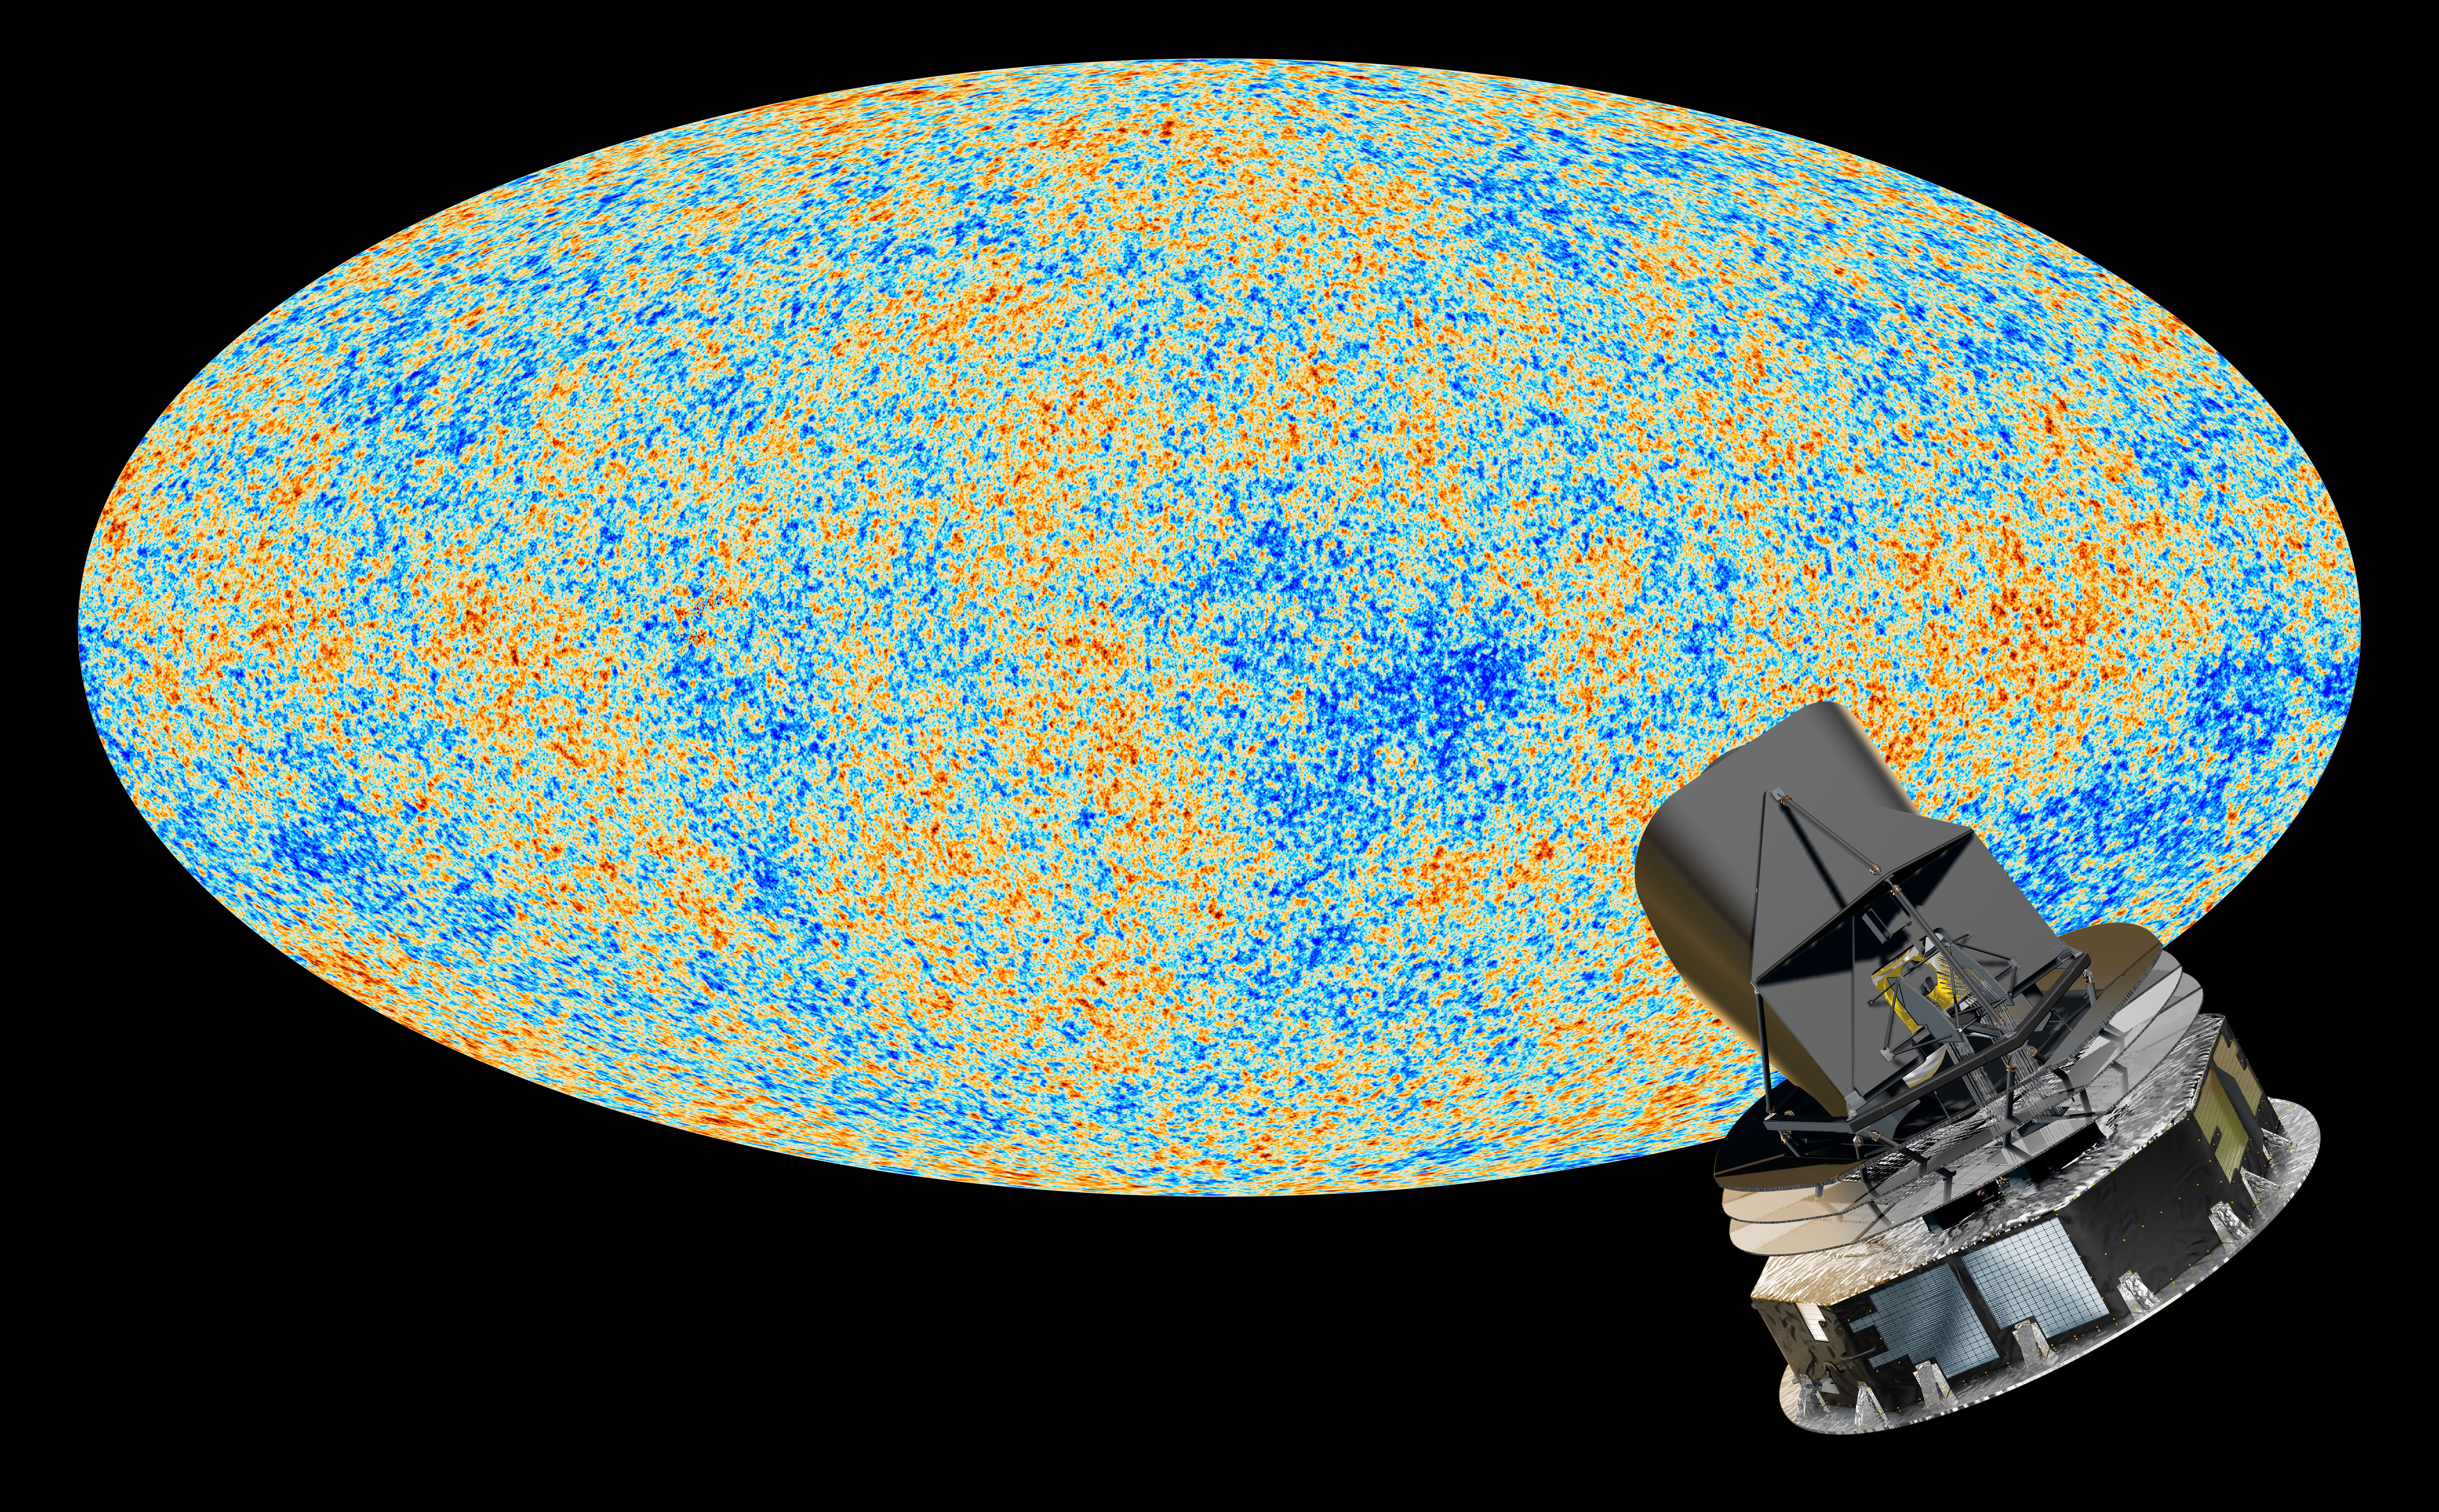
For a public outreach talk I wanted to start with the importance of the Cosmic Microwave Background (CMB) for our understanding of the evolution of the universe. Then I remembered this anecdote that you can “see” the CMB radiation in the noise of your analog TV (if you still have one) and started wondering if that is actually true…
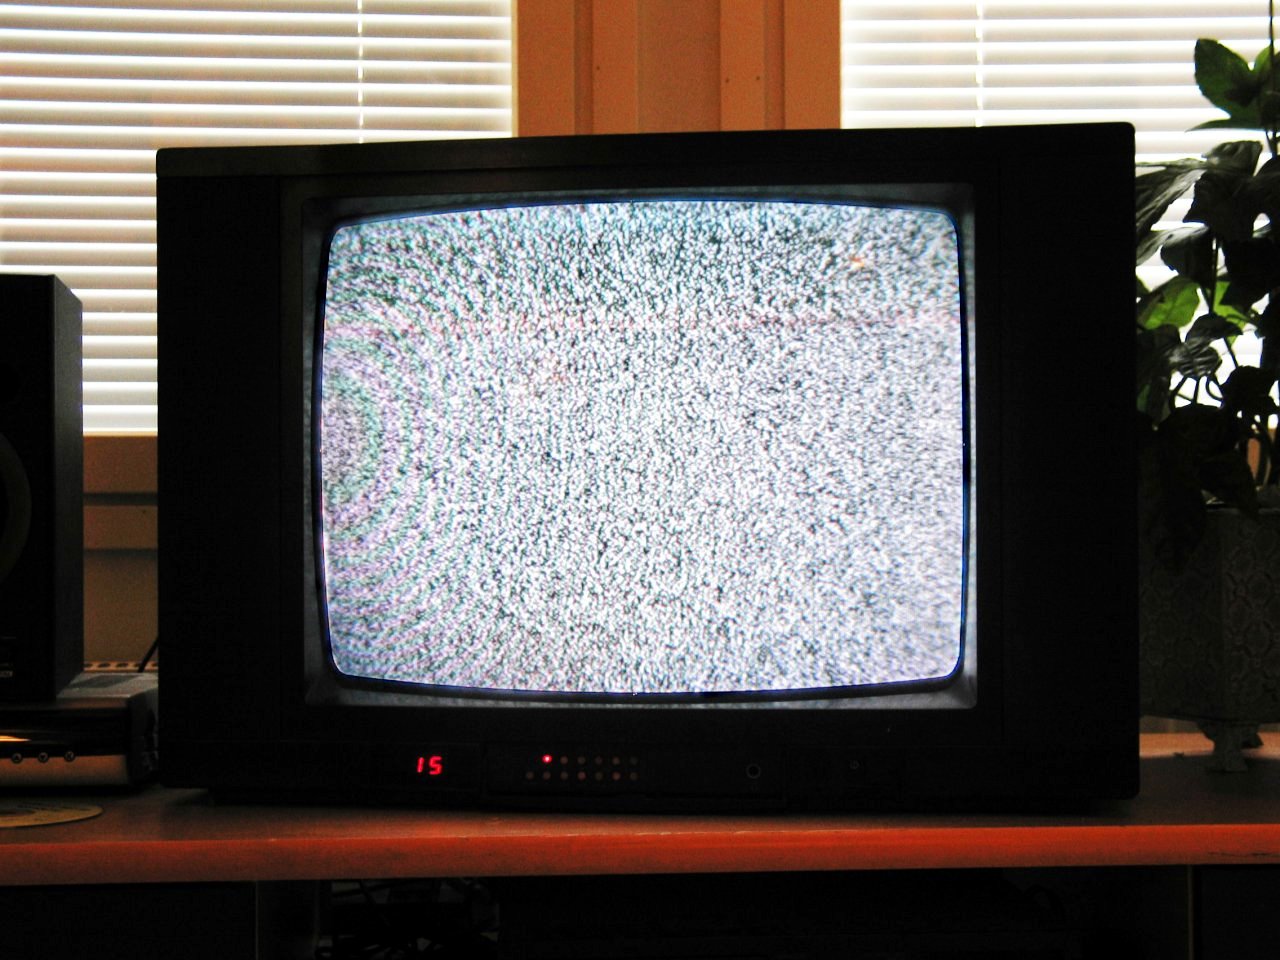
On the web there are several sources claiming that 1% of the noise between the channels of your TV programme are CMB, but I couldn’t find any actual calculation. So I tried my own.
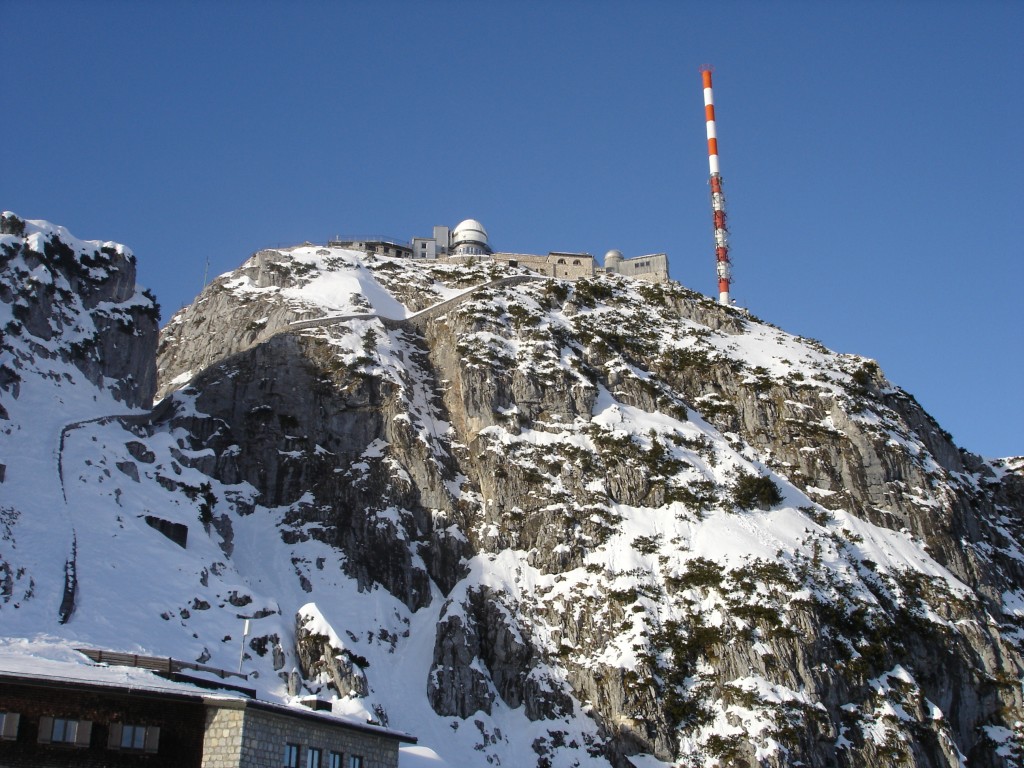
Since I’m not an antenna expert and couldn’t immediately find some meaningful numbers for the radiation for analog terrestrial TV, I used this to come up with an order of magnitude number:
The old analog sender on top of mount Wendelstein in Upper Bavaria radiated at 0.4 kW in channel 48 according to the Wikipedia page. Channel 48 is at about 680 MHz and has a bandwidth of about 8 Mhz. This sender was apparently only used to broadcast to Bayrischzell which is about 2 km away. The sender had a round radiation pattern, i.e. it radiated in all directions, but only in one plane. However, since the town of Bayrischzell has a finite length, the half-power beam-width cannot have been too small. I assume here an H/R of ~ 0.2, i.e. at 2 km distance the half-power beam-width should be ~ 400m (i.e. illuminating an area of 5e6 m^2 at that distance). This is of course only a crude estimate, but for an order of magnitude calculation it should be OK. The specific flux received in Bayrischzell from this sender is thus
0.4 kW / (5e6 m^2 * 8e6 Hz) = 1e-11 W(m^2 Hz) or about 1e15 Jansky (in radio astronomers’ units)
OK, now let’s look at the specific flux of the CMB. This is easy, we just need to substitute proper values (2.7 K, 680 MHz) in the Planck equation and arrive at a specific flux of about 5.4e5 Jansky at the frequency used for the local TV station.
Now we need to compare this not to the signal strength estimated above, but to the estimated noise level of a typical analog TV receiver system. This is a bit tricky, but typical carrier-to-noise ratios (CNR) should be of some help. The carrier-to-noise ratio is the signal-to-noise ratio of a modulated signal. I didn’t find any recommended CNR values for terrestrial analog TV, but other CNR values for TV might give some guidance. In an article published with the Society of Cable Telecommunications Engineers, this guidance is given:
The FCC’s minimum CNR is 43 dB, which, in my opinion, is nowhere near good enough in today’s competitive environment. Indeed, most cable operators have company specs for end-of- line CNR somewhere in the mid to high 40s, typically 46 to 49 dB.
The National Association of Broadcasters Engineering Handbook (p. 1755) has a similar statement:
Noise will become apparent in pictures as the carrier-to-noise ratio (CNR) approaches 43-44 dB […]; a good design target is 48-50 dB.
So let’s assume the sender on mount Wendelstein is calibrated such that is achieves a CNR of 50 dB for the terrestrial analog broadcasting of the local TV station in nearby Bayrischzell. This means the signal is a factor 100,000 (1e5) stronger than the noise.
In this case, the noise level in the TV is about 1e10 Jy or about 200.000 times larger than the CMB signal. So, if this calculation is correct, it seems unlikely that you would be able to see the CMB signal while searching for signal with your analog terrestrial TV.
An analysis of astro-ph submit times
Recently I submitted another paper to astro-ph and I wanted to play the “first” game and try to get my paper on top of the daily listing. Now, it is well documented that the deadline for the daily submissions is 16.00 EST meaning that if you submit just after that deadline you’re paper is likely to appear on top of the next day’s mailing. (NB: the announcement is inverse on the web page)
But how likely do you get your paper on top if you submit right in time? For the above mentioned paper I had prepared everything before hand. This took a bit of time since arxiv.org didn’t accept a
\maketitle
after the abstract but only spewed out weird errors about lines that aren’t ending etc. So I had prepared everything, even submitted the paper and un-submitted it again.
Then, at 20.59.59 GMT and a split second I hit the submit button. It took more than three minutes for the server to handle this request. Still, I was quite amazed that the paper appeared only as #6 (#19 if counting also the cross-lists) from the bottom of the webpage (i.e. top of presumably more important mailing), despite having been registered by the server at 21.00.04 GMT. So I used my much-loved bash tools curl, awk and grep and extracted the submission times of all astro-ph submissions this year until October and found this:
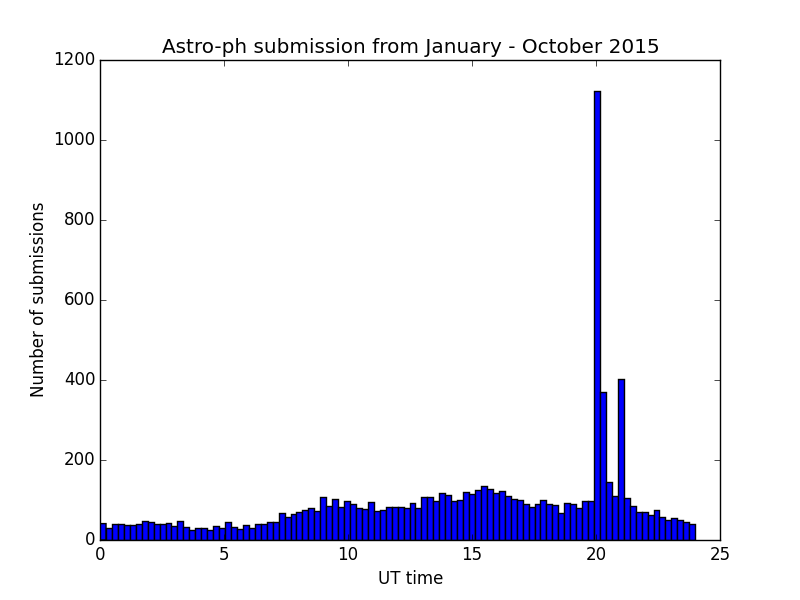
There is a clear spike at 20.00 UT (which is 16.00 EDT = UTC-4) and a smaller one at 21.00 UT (corresponding to 16.00 EST = UTC-5) — most of the year so far has had (Northern hemisphere) summer time. I don’t have an explanation for the smaller and wider peaks at about 9.00 and 16.00 UT. Now we can also zoom in to the region around 20 / 21:
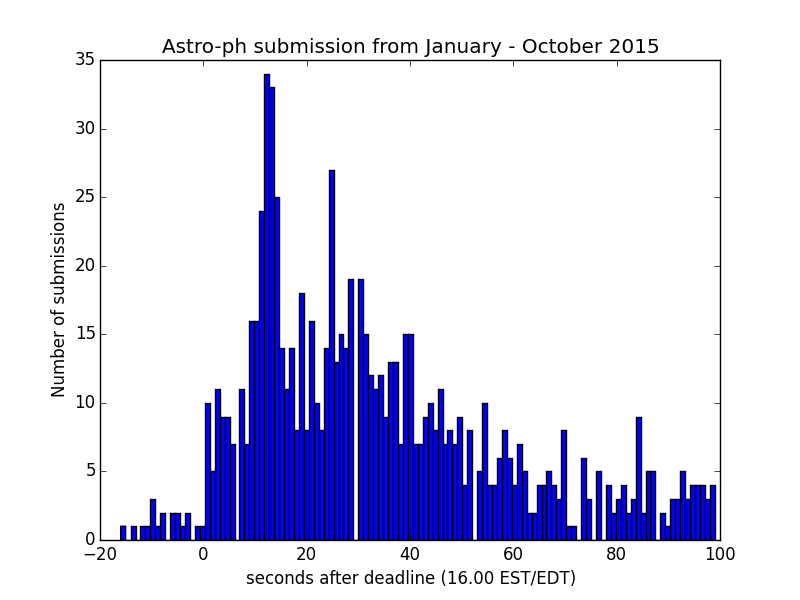
We see that the peak submission time (which is when the submission is registered by the server) is at about 12 seconds after the deadline. Going back to my case — submitting right at the deadline, registered 4 seconds after the deadline (despite server only replying 3 minutes later) — we can ask: what are the chances of getting on top if you submit within 4 seconds? Over these 10 months (ca. 200 submission days), there have been 26 submissions in this timeframe, i.e. your chances of getting on top if submitting so close in time should be almost 100%. It just so turns out, however, that on the particular day when I submitted, there were five papers submitted even closer to the deadline. Tough luck. 😉 Hopefully, however, this will play less of a role in the future as more and more people read their daily astro-ph through voxcharta or similar services where the announcement order is either randomized or sorted according to your preferences.
Querying the ESO archive
As the big observatories of the world observe ever more astronomical objects, their archives become powerful research tools. Finding out whether an object has been observed with a certain instrument is just a few mouse clicks away, if the observatory has a public archive like ESO provides for all VLT instruments.
However, if you would like to perform more complex searches, the web interface may not be enough, although it has become very comfortable to use, especially with Astropython’s astroquery package.
For a research project, I recently needed to find all local AGNs ever observed with a certain instrument (SINFONI at the VLT). Since I didn’t know the target names or programmes, I got all unique observed coordinates, resolved them via Simbad (which also gives the class of an object) and then selected the AGNs among all the targets.
Since ESO unfortunately does not provide direct access to the archive database, a query like “give me all unique observed coordinates” is not possible per se. So I had to download all headers, parse the relevant information and build my own database (SQLite for the moment).
I have a script to collect the metadata, which does this:
- query the ESO archive for all observations of a day
- then parse the resulting html file for the unique identifiers of each dataset (“data product ID” or DPID, e.g. XSHOO.2015-04-13T04:46:11.730)
- download the header for the given DPID
- parse the header for relevant information and construct an SQL insert statement
- insert all into a database
There are also scripts that
- query the database for all programmes and search metadata (PI/CoI names, titles) for them
- get atmospheric data for all observations (querying the ambient conditions server)
- And there is a top-level script that calls all of these scripts in a meaningful way and that I call about once a month or when needed to update the database.
My database consists of one table for each ESO instrument that I am interested in (currently MIDI, SINFONI and X-SHOOTER), a table with programme meta data (PI/CoI names and titles), a table with atmospheric data as well as tables with basic information about calibrators and science objects that I use for matching up observations and building LaTeX tables in a scripted way. This has become quite handy over the recent years and has helped me in building the largest sample of interferometrically observed AGNs with MIDI (Burtscher et al. 2013) as well as the largest sample of local AGNs observed with SINFONI (Burtscher et al. 2015) and a follow-up paper (submitted).
In case you are interested in tables that I have already compiled and am maintaining, please contact me and I will be happy to share the database with you. It is currently about 700 MiB and I update it every month.
Apart from nice science, one can also use this database to create other plots of interest, like a map of the exposure depth of SINFONI for example:

Interestingly, the Galactic Center (at 17:45h, -29 deg) is not the field with the deepest SINFONI integration time (“just” about 400 hours). Instead the Extended Chandra Deep Field South is the deepest SINFONI field with about 600 hours of integration time. Another field with deep coverage is the COSMOS south field (10:00h, +02 deg). About 300 hours of total integration time have been spent on this field.
Update 12 Jan 2016: I have now put my codes and the database online. Please see the github project page for further details on how to use these.
Two strange and funny astronomy papers
…that are actually refereed articles or made it at least to astro-ph:
- Gates, V.; Kangaroo, E.; Roachcock, M.; Gall, W. C.: Stuperspace – a classic. If you don’t know it, read it immediately. That is, hold on a minute… First read a quantum field theory article like this to fully value the former article…
- Douglas Scott, Ali Frolop: Down-sizing Forever. An April’s fool article on astro-ph that reaches the astonishing conclusion that “the early Universe was in fact a giant galaxy”.